How to Make a Simple Budget in Google Sheets
by Abdulrasaq • Life Hacks • August 10, 2025
Budgets work best when they’re simple. This Google Sheets setup gives you one clean page to plan your month, one table to log spending, and automatic totals that show what’s left. No subscriptions, no add-ons-just a spreadsheet that’s easy to reuse every month.
Step 1 - Create the File & Two Sheets
- Open Google Sheets → Blank. Name it Monthly Budget.
- At the bottom, rename the first sheet to Budget. Click + and add Expenses.
Step 2 - Categories, Income & Planned Amounts (Budget)
- In
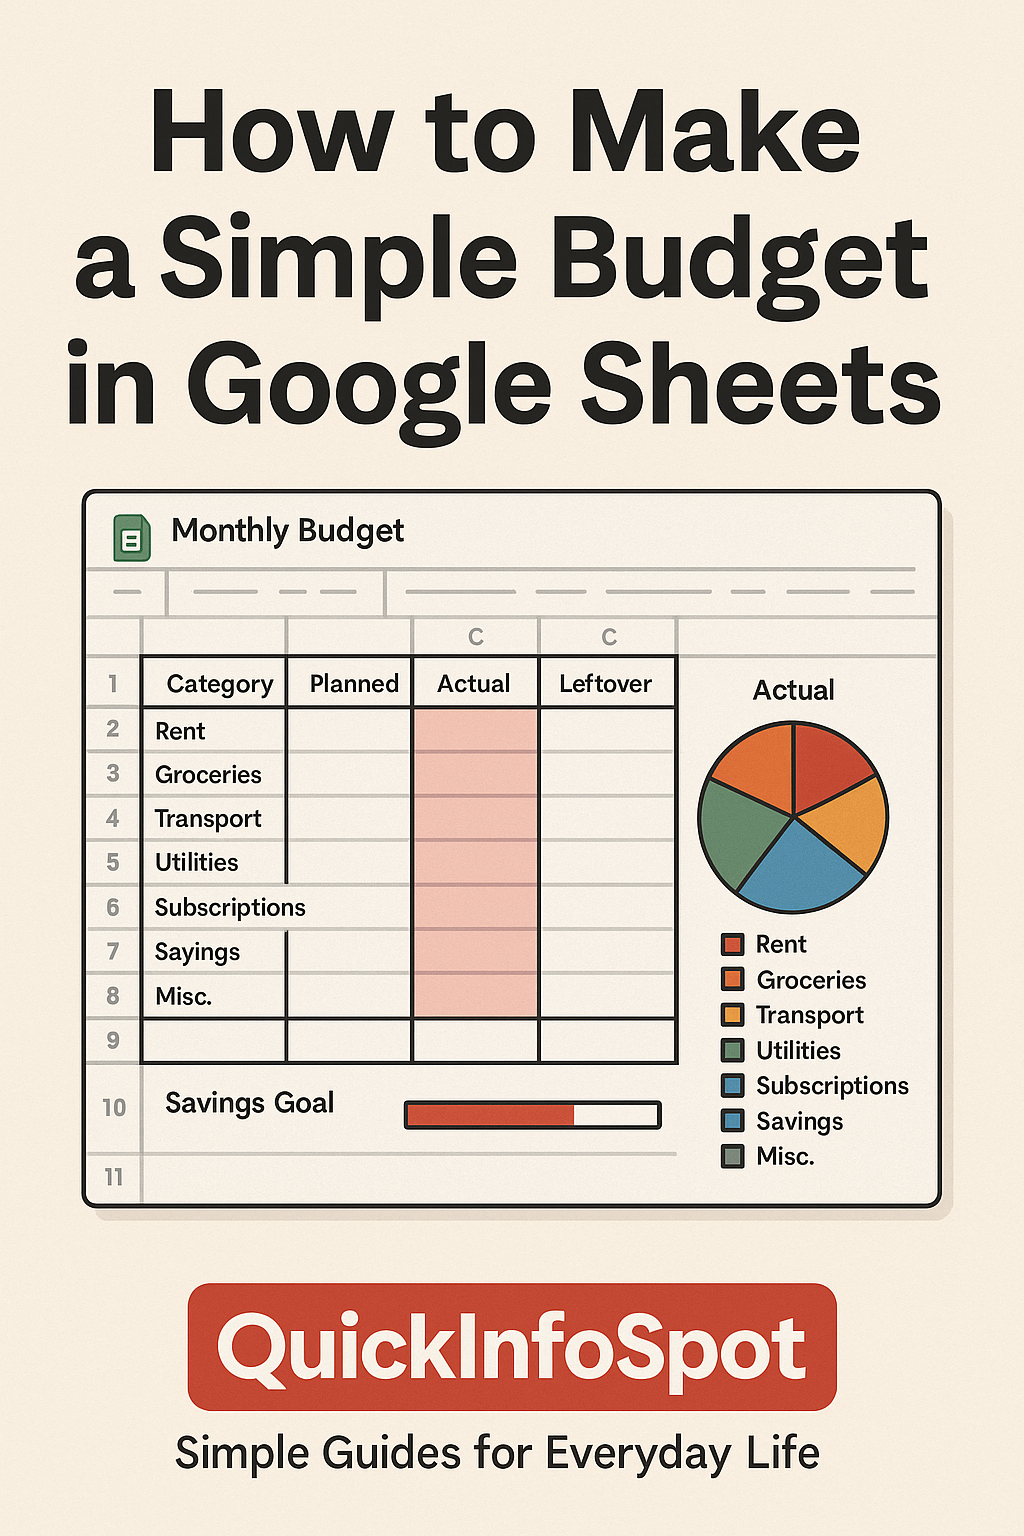
A1:D1add headers: Category, Planned, Actual, Leftover. - In
A2:Alist categories, e.g. Rent, Groceries, Transport, Utilities, Subscriptions, Savings, Misc. - In
B2:Benter your Planned amounts per category. - At the top, add
F1: Income andF2: your monthly take-home. - Total planned: in a cell under your list (e.g.
B10):=SUM(B2:B9).
Step 3 - Expense Log (Expenses)
- In row 1 add: Date, Category, Description, Amount.
- Select the Category column → Data → Data validation → List from a range → choose
Budget!A2:Aso your categories appear as a dropdown. - Format Amount as currency. Optional: freeze row 1 (View → Freeze → 1 row).
Step 4 - Link Actuals & Leftover (Budget)
- In
C2(Actual) enter:=SUMIF(Expenses!B:B, A2, Expenses!D:D)and copy down. - In
D2(Leftover):=B2 - C2and copy down. - Total actual (e.g.
C10) =SUM(C2:C9)• Total leftover (e.g.D10) =SUM(D2:D9). - Net for the month: In
F4use=F2 - C10to see how much of your income is unspent.

Step 5 - Quick Chart & Visuals
- Select Category and Actual columns → Insert → Chart → Pie (Actual spend by category).
- Add conditional formatting on Leftover (D2:D) to highlight negatives in red and positives in green.
- Optional progress bar for Savings: in a separate cell, set a goal (e.g. 20% of income) and use a bar-style conditional format on the Savings row.
Step 6 - Make It Reusable
- New month: Duplicate the entire file or add a new pair of sheets (e.g. “Jan 2026”) and keep your formulas.
- Copy validation: If you add new categories on Budget, they instantly show up in the Expenses dropdown.
- Mobile logging: Open the Expenses sheet on your phone and add purchases as you make them.
Extras You’ll Actually Use
- Planned vs. Actual %: In
E2:=IFERROR(C2/B2,0)(format as %) to see where you’re overspending. - Rolling balance: Add a “Balance” row:
F6=F2 - C10so you always see money left this month. - Notes column: Add a column on Budget for quick reminders (e.g., “Cancel trial on the 20th”).
Common Mistakes to Avoid
- Too many categories-keep it under 10 or you’ll stop using it.
- Using planned numbers as actuals-only log real spending in Expenses.
- Forgetting income changes-update
Incomewhen your pay varies.